RSS

Thoughts on the housing market from a mortgage broker in Vancouver

Vancouver mortgage broker perspective

Before I begin, I would like to give thanks to Bobby for allowing me to write this guest column on his website and to share my message with a new audience.  I think it is helpful to get different viewpoints when considering such a large purchase as buying a home, and as a mortgage broker in Vancouver, I am able to provide a unique perspective on the market.

What is happening in the real estate market?

Being a mortgage broker in Vancouver has given me a different viewpoint of the market compared to a realtor, as I am more versed with numbers than a typical Realtor©.  The statistics as it stands are indicative of a slow-down in the housing market.  It is early right now, and it remains to be seen whether or not this is going to be a prolonged correction of the housing market, or whether it will pick up again within the next few months.  Or a bit of both.  The trend, in my opinion, is looking downwards.  More on that shortly.

The housing market cycle


Why would it pick up in the months to come, but still be indicative of a correction?  It is because there is an annual cycle of hot and cold within a year.  The quietest month of the year for real estate is December, and the market gradually heats up as the spring approaches where it reaches its peak in May-July of each year before slowing down again. You can see that in the graph below.  It is a representation of the last 10 years of statistics for the real estate market in Surrey.  So, depending on the time of year, you are likely to see a hotter, or a colder market than at another time of year, but it does not mean that the market has changed.

The one (or two) graphs that says it all

This is sales to active listings graph for Surrey real estate with a rolling 12 month average.


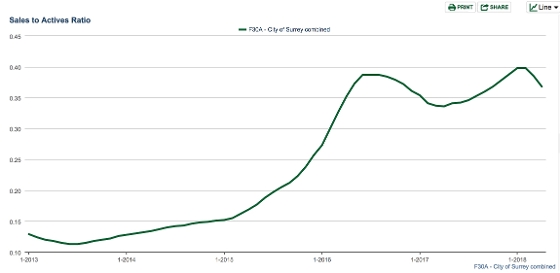
It shows the market picking up dramatically from about January 2015 through August 2016 at which point the BC government introduced the foreign buyers tax, after which it has been relatively flat.  No cause for worry, right? Look at this:


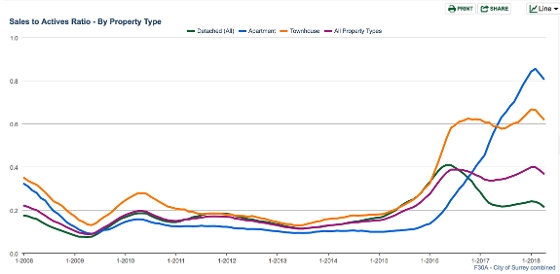
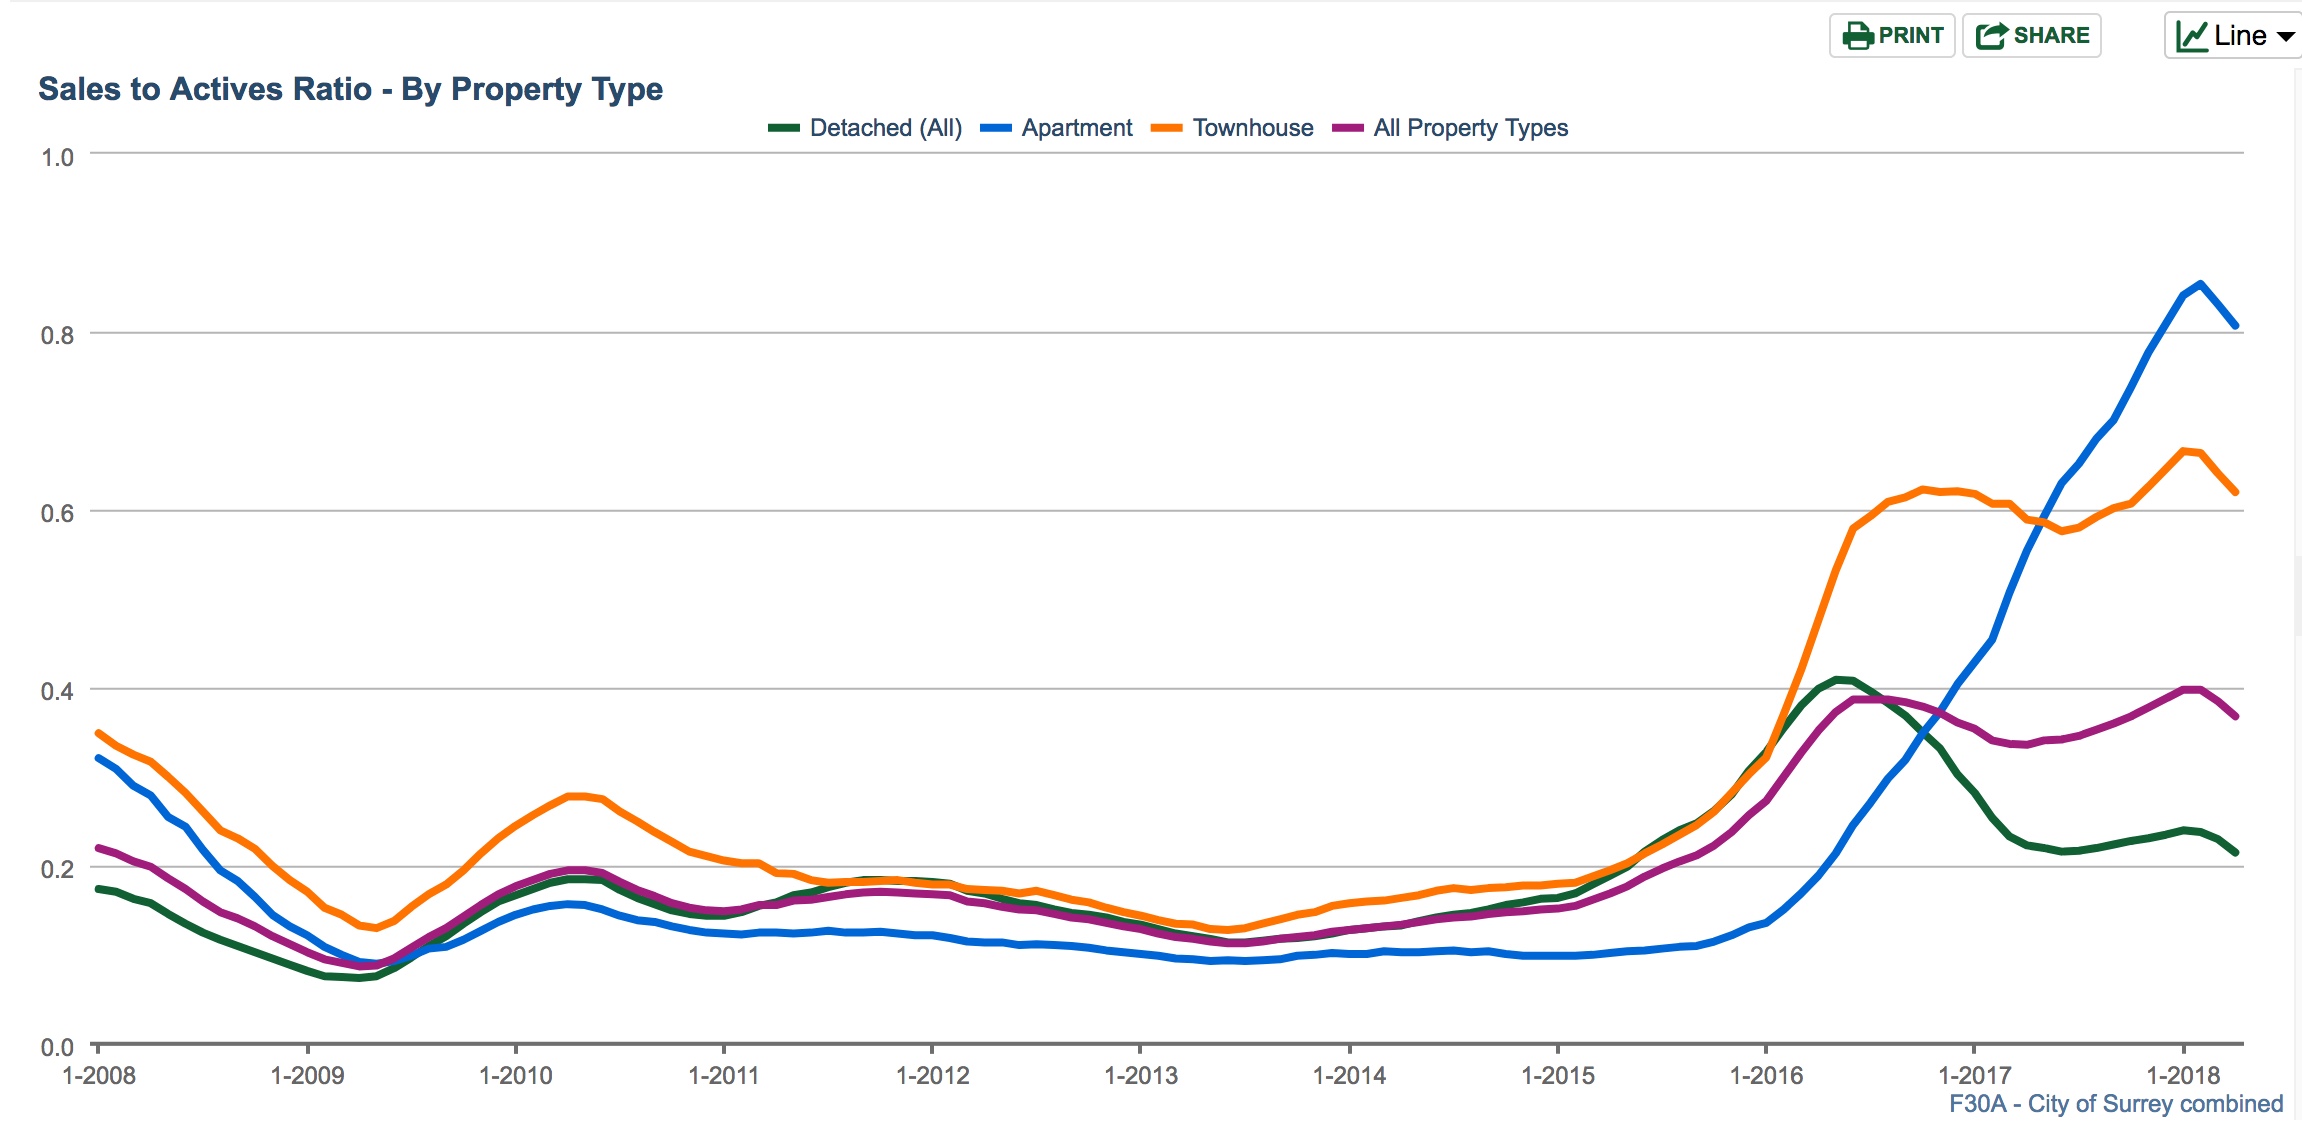
This is the same graph for Surrey, but broken down by property type.  The blue line represents condominiums.  The green is detached houses.  Detached houses peaked in June 2016 and went on a major slide shortly afterward (foreign buyers tax?).  But they did not recover.  Prices went up, but the hot market is was gone. The blue line started a massive incline in January 2016, reaching its apex in February 2018.  It is now starting to decline for the first time in years.  It has been increasing for over two years, but for many years before that, it was flat, not decreasing or increasing. Also, notice that since January 2016, the only market segment that was increasing in demand was the condo market.  Everything else was relatively flat.  Now, since February, all segments are now down.  I think prices could possibly still go up a little in the short term, and condos should still see some price growth, but all the segments are now going down in demand. I believe this to be the top of the market. Why do I feel this way?

What changed in the Greater Vancouver housing market?

In January of 2017, the federal government introduced  a new "stress test" that impacted insured mortgages, and also introduced other measures to cool the housing markets of Vancouver and Toronto.  In January 2018, the government expanded this to include all mortgages, regardless of the amount of down-payment. This had the effect of decreasing the qualification of borrowers by around 20%, and many of them were going for as much as they could in order to buy what they needed. Interest rates have also been on a continuous upward climb since the beginning of 2016, where I could get a 5 year fixed rate at 2.29%.  The latests 5 year fixed rates are in the 3.2-3.7% range.  Beyond the stress test limiting qualification, this increase has a real world impact on housing affordability. Why else do I feel we are now at the top of the market?  Simply put, the ability of average residents of Vancouver to own property is near its maximum.  The Surrey median income in the last census was $77,494.  For 2018, lets add 8% to that, and estimate it to be $83,693.  Assuming they have credit scores over 680 and not a lot of debt, and subtracting property tax, heat and strata fees, the maximum mortgage payment that the "stress test" would qualify for is $2,303/month.  That supports a mortgage amount of approximately $380,000.  The average apartment in April 2018 benchmark was $466,000 for Surrey, one of the most affordable regions in Greater Vancouver. This means the average person in Surrey, to buy the average apartment in Surrey, will need approximately 20% down in order to get into the market.  I think there are many other factors in play, like under the table income people may receive, or getting assistance with the downpayment from relatives, etc, but for many people, that puts home ownership out of reach, and many others are going to be strained to meet this.

Obeservations

Ultimately, it is up to each individual to determine what is best for them to do, and this is not legal advice and you assume responsibility for your actions.  However, my thoughts on the market are:
  • If you are considering selling your home soon, this is a good time to do so.  Get the best offer you can get and sell.
  • If you are selling and then buying, its to your advantage if you are moving up, as the detached and townhouse markets are already significantly cooler than the condo market.
  • If you are happy with where you are living, and you plan to be there for a while, you can likely wait out any market correction.
  • If you are planning on buying a home, this could be one of the best opportunities to get into the market that you have had in at least 2 years.
  • I would not be comfortable flipping properties in this market.
  • I feel that detached houses will be the hardest hit segment of a correction, and will be the first segment that gets hit.
One other wildcard that I can see is that inventory on the market took a significant downturn at the start of 2015 and has been on a downward trend the last 3 years.  It would seem that this one statistic would indicate that there is less housing options than ever, and could also be a factor that is propping up a market at the verge of a correction.  Inventory of condos is so low right now in Surrey compared to historical levels.  I think it is worth noting that the sales to listings ratio for apartments may be so high not because of strong sales as much as it is just a lack of inventory.  How that will change or when it will change, I don't know. Although I am a mortgage broker in Vancouver, I also can help clients in Surrey, and have worked closely with Bobby for many years now.  I cannot give any substantial market advice, or help you with buying a home as a mortgage broker.  Give Bobby a call for more information on that kind of information, or give me a call at 604-318-1292 for mortgage financing information.
Read

Latest Stats for the Fraser Valley Real Estate Board

Demand for Fraser Valley homes remains unchanged despite change of season

SURREY, BC – Residential property sales in the Fraser Valley remained strong in September, with both attached and detached homes performing well throughout the region.

The Fraser Valley Real Estate Board processed 1,619 sales of all property types on its Multiple Listing Service® (MLS®) in September, an increase of 24.1 per cent compared to the 1,305 sales in September of last year, and a 13.8 per cent decrease compared to the 1,879 sales in August 2017. This was the fifth highest sales total for a September in the Board’s history.

Of the total sales processed 392 were townhouses and 470 were apartments, together representing 53% of market activity in September.

“Often we see summer demand continue as far as October, so it’s not unusual to have another strong month before the seasonal cool down," said Board President Gopal Sahota. “What’s unusual this year is that attached inventory sales are still driving the market despite the increased competition we’re seeing there.”

Last month the total active inventory for the Fraser Valley was 5,854 listings. Active inventory increased by 2.5 per cent month-over-month, and decreased 8.8 per cent when compared to September 2016.

The Board received 2,848 new listings in September, an 8.2 per cent decrease from August 2017, and a 5.1 per cent increase compared to September 2016’s 2,709 new listings.

"It’s also interesting to observe the return to a balanced market for detached homes here in the Valley,” continued Sahota. “While pricing remains stable, competition for houses has simmered and listings are staying on market longer. If you were waiting to make a move or upgrade, now might be a good time to talk to your REALTOR® and see what’s out there.”

For the Fraser Valley region the average number of days to sell an apartment in September was 19 days, and 18 days for townhomes. Single family detached homes remained on market for an average of 29 days before selling.

HPI® Benchmark Price Activity

• Single Family Detached: At $974,500, the Benchmark price for a single family detached home in the Valley decreased 0.2 per cent compared to August 2017, and increased 11.2 per cent compared to September 2016.

• Townhomes: At $498,900 the Benchmark price for a townhome in the Fraser Valley increased 1.4 per cent compared to August 2017, and increased 17.7 per cent compared to September 2016.

• Apartments: At $358,200, the Benchmark price for apartments/condos in the Fraser Valley increased 2.5 per cent compared to August 2017, and increased 35.2 per cent compared to September 2016.

Read

SURREY, BC – While overall market activity slowed slightly in June, apartment sales reached record-breaking levels at 683 transactions for the month.


The Fraser Valley Real Estate Board processed 2,571 sales of all property types on its Multiple Listing Service® (MLS®) in June, a decrease of 10.2 per cent compared to the 2,864 sales in June of last year, and a 5 per cent decrease compared to the 2,707 sales in May 2017.


At 683 sales, apartment transactions represented 27 per cent of all sales activity in the Fraser Valley in June, increasing 13.1 per cent compared to apartment sales in June 2016 and 12.2 per cent compared to May 2017. The average number of days to sell an apartment in June was 15 days, compared to 32 at this time last year.


"We knew that there was a growing appetite for our attached properties, but this month was exceptional," said Gopal Sahota, Board President. “I think one reason demand has continued to be so strong for our region is that we have such diverse, robust inventory to help buyers find the right home even in a more complex market like this one.”


Last month the total active inventory for the Fraser Valley was 5,487 listings. Active inventory decreased by 2.2 per cent year-over-year, and increased 5.5 per cent when compared to May 2017.


The Board received 3,707 new listings in June, a 0.1 per cent increase from June 2016, and a 0.1 per cent decrease compared to May 2017’s 3,712 new listings.


Sahota added, "More and more buyers are looking for affordable entry points in to the Fraser Valley. No matter what you’re trying to sell – from townhomes to ranchers – if it’s priced right, someone will be knocking on your door.”


For the Fraser Valley region, the average number of days to sell a single family detached home in June 2017 was 21 days, compared to 17 days in June 2016.


HPI® Benchmark Price Activity 


• Single Family Detached: At $934,600, the Benchmark price for a single family detached home in the Valley increased 2.1 per cent compared to May 2017, and increased 8.5 per cent compared to June 2016.


• Townhomes: At $467,000 the Benchmark price for a townhome in the Fraser Valley increased 1.8 per cent compared to May 2017, and increased 20.6 per cent compared to June 2016.


• Apartments: At $325,300, the Benchmark price for apartments/condos in the Fraser Valley increased 10.3 per cent compared to May 2017, and increased 40.3 per cent compared to June 2016.


Full package:


http://www.fvreb.bc.ca/statistics/Package201706.pdf

Read

Growing sales in Fraser Valley met with bump in new inventory SURREY, BC – The Fraser Valley saw a much-needed increase to new housing inventory entering the market in May, supporting growing demand for residential properties in the region. Last month marked the highest level of sales for the Fraser Valley since June of last year, and the second-highest level for a May historically. The Fraser Valley Real Estate Board processed 2,707 sales of all property types on its Multiple Listing Service® (MLS®) in May, a decrease of 7 per cent compared to the 2,911 sales in May of last year, and a 21.4 per cent increase compared to the 2,230 sales in April 2017. Of the 2,707 sales processed last month, 620 were townhouses and 609 were apartments. Attached home sales combined continued the 10-month trend of surpassing detached sales in the region. “The further we get into this year’s market, the less 2016 looks like an anomaly in terms of demand and sales activity. If it wasn’t clear before, the Fraser Valley is now a prime, highly sought-after destination for home owners of all types," said Gopal Sahota, Board President. In May the total active inventory for the Fraser Valley was 5,203 listings, a decrease of 9.5 per cent year-over-year, and an increase of 5.9 per cent compared to the available inventory in April 2017. The Board received 3,712 new listings in May; a 1 per cent increase from last year’s 3,674 new listing for the month, and a 25.8 per cent increase compared to April 2017’s incoming listings. "We’re very happy to see the bump inventory we were looking for in April. I think sellers will certainly be glad that demand hasn’t let-up since the start of the spring market and more options for potential buyers is always a good thing. ” For the Fraser Valley region, the average number of days to sell a single family detached home in May 2017 was 23 days, compared to 16 days in May 2016. HPI® Benchmark Price Activity


• Single Family Detached: At $915,800, the Benchmark price for a single family detached home in the Valley increased 3 per cent compared to April 2017, and increased 9.8 per cent compared to May 2016.


• Townhomes: At $458,900 the Benchmark price for a townhome in the Fraser Valley increased 2.9 per cent compared to April 2017, and increased 25.7 per cent compared to May 2016.


• Apartments: At $295,000, the Benchmark price for apartments/condos in the Fraser Valley increased 3.4 per cent compared to April 2017, and increased 31 per cent compared to May 2016.

Read

SURREY, BC – Propelled by significant activity in attached categories, March housing sales in the Fraser Valley reached their second highest point in ten years, trailing only last year’s extraordinary market levels.


The Fraser Valley Real Estate Board processed 2,213 sales of all property types on its Multiple Listing Service® (MLS®) in March, a decrease of 26.4 per cent compared to the 3,006 sales in March of last year, and a 58.5 per cent increase compared to the 1,396 sales in February 2017.


Of the 2,213 sales processed last month, 526 were townhouses and 638 were apartments, representing over half of the region’s total sales of all property types for the seventh straight month.


“Inventory levels aren’t where we’d like them to be, especially with demand picking up as we move deeper into the spring season," said Gopal Sahota, Board President. “However, that being said, it’s great to see more buyers turning to our bourgeoning apartment and townhome markets and taking some of the pressure off of detached homes.”


Last month the total active inventory for the Fraser Valley was 4,808 listings, the lowest level seen for a March in ten years. Active inventory increased by 3.5 per cent month-over-month, and decreased 12.3 per cent when compared to March 2016.


The Board received 3,072 new listings in March, a 41.5 per cent increase from February 2017, and a 24.3 per cent decrease compared to March 2016’s 4,057 new listings.


"We've never seen sales like this for our attached category homes. Whereas buyers may have had a more relaxed experience looking for a townhome a few years ago, things have certainly changed: competition is up, and listings are moving fast”, added Sahota.


“Talk to your REALTOR® to help you understand what’s happening in your community. The support of a local expert goes a long way when navigating a busy spring market here in the Valley.”


HPI® Benchmark Price Activity


• Single Family Detached: At $869,000, the Benchmark price for a single family detached home in the Valley increased 1.1 per cent compared to February 2017, and increased 17.3 per cent compared to March 2016.


• Townhomes: At $432,100 the Benchmark price for a townhome in the Fraser Valley increased 2.3 per cent compared to February 2017, and increased 25.5 per cent compared to March 2016.


• Apartments: At $276,900, the Benchmark price for apartments/condos in the Fraser Valley increased 3.7 per cent compared to February 2017, and increased 27.5 per cent compared to March 2016.


Full package:


http://www.fvreb.bc.ca/statistics/Package201703.pdf

Read
Reciprocity Logo The data relating to real estate on this website comes in part from the MLS® Reciprocity program of either the Greater Vancouver REALTORS® (GVR), the Fraser Valley Real Estate Board (FVREB) or the Chilliwack and District Real Estate Board (CADREB). Real estate listings held by participating real estate firms are marked with the MLS® logo and detailed information about the listing includes the name of the listing agent. This representation is based in whole or part on data generated by either the GVR, the FVREB or the CADREB which assumes no responsibility for its accuracy. The materials contained on this page may not be reproduced without the express written consent of either the GVR, the FVREB or the CADREB.